Introduction
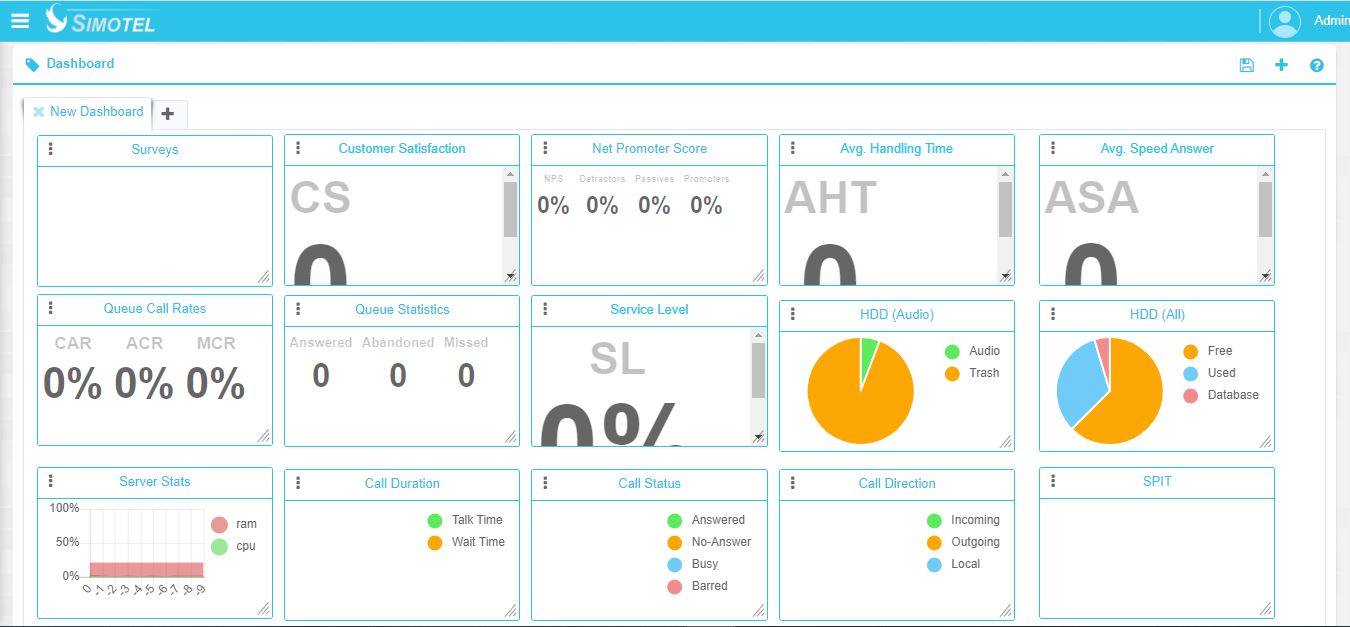
In this section, live reports of the performance of different system components are displayed. This section provides monitoring metrics for the Call Center in the form of components, allowing the system administrator to select desired components and design a personalized dashboard.
Monitoring Components
-
Component Box: The area where all available components are displayed (click on the ➕ at the top right to display the box).
-
Component: Each component is responsible for displaying a specific metric or report.
-
Design Grid: The white background of the monitoring screen.
-
Page Navigation: Use the ➕ key at the top left to create multiple pages for categorizing and creating different reports.
-
Save Button: Any changes made in the monitoring editor are local and only saved and applied when the save button is clicked in the system.
-
Help Button: A tool for guiding the monitoring components.
Actions in the Monitoring Section
-
Drag and Drop: To add a component to the grid, first, grab it from the component box with the mouse and drop it onto the grid.
-
Delete Component: Click on the Action button, represented by three dots in the top bar of the component, and select Remove to delete it.
-
Edit Component Parameters: Click on the Action button and select Edit to modify the component's parameters.
-
Move Component: Hold down the mouse button on the component's name (top bar) and move it.
-
Add New Page: Use the ➕ button at the top left to create multiple pages.
-
Delete Page: Click on the X button in the upper left corner of each tab to delete the page.
-
Resize Component: Click on the three diagonal lines at the bottom left corner of the component to resize it.
-
Save Page Changes: Click the Save option at the top left.
Data analysis in the dashboard is available for up to 24 hours ago. If you need information from previous days, you must access the user reports section.
Component Categories
Overall, the dashboard components are divided into three main categories:
Real-Time Components
These components display outputs in real-time with minimal delay. They include:
- Trunk Status: Displays the status of trunks.
- Server Stats: Provides a report on server resource usage (CPU, RAM).
- Exten Status: Displays the status of extensions in the Call Center.
- Agent Status: Displays the status of Call Center agents.
Queue Components
These components are specifically designed to analyze and report on queue metrics. They include:
- Avg. Handling Time: The average call handling time in the queue (in seconds).
- Avg. Speed Answer: The average response time to calls in the queue (in seconds).
- Queue Call Rates: Provides a report on call status based on queue metrics in the Call Center (percentage).
- Queue Statistics: Provides a report on the call status in the queue (count).
- Service Level: A key metric related to queues that will be discussed in more detail later (percentage).
General Components
These components can report on both queues and extensions and are not limited to either category. Other components provide general reports about the Call Center, such as:
- Net Promoter Score: Provides a report on the Net Promoter Score (percentage).
- Customer Satisfaction: Displays a report on the average customer satisfaction based on surveys (score).
- Surveys: This component functions similarly to Customer Satisfaction.
- HDD (Audio): Provides a report on disk usage by audio files.
- HDD (All): Provides a report on the overall server disk usage.
- Call Duration: Provides a general report on call and wait times (in seconds).
- Call Status: Provides a general report on call statuses (answered, unanswered, busy, blocked) in the Call Center.
- Call Direction: Provides a report on the types of calls (incoming, outgoing) in the Call Center.
- SPIT: Displays storm calls in the Call Center.
Shared Parameters
In the Edit section of all monitoring components, there are common parameters that we will review:
-
Title: This parameter sets the display name of the component on the page.
-
View as: The monitoring section offers different modes for displaying component information. This parameter allows you to switch between display modes, including:
- Pie Chart: Display as a pie chart.
- Bar Chart: Display as a bar chart.
- Line Chart: Display as a line chart.
- Table: Display as a table.
- Number: Display as a number.
- Column: Display in column format.
- Row: Display in row format.
- Grid: Display in grid format.
-
Items: This parameter allows you to specify exactly which metric from the report should be displayed in the component.
